Stocktuitive
Guided fundamental analysis for retail investors.
Stocktuitive is a full-stack fintech project that turns ticker input into a guided fundamental analysis workflow; 70+ financial metrics, plain-English verdicts, charts, and a portfolio-safe interactive demo powered by cached NVDA data.
[ Product Proof ]
Guided Analysis Demo
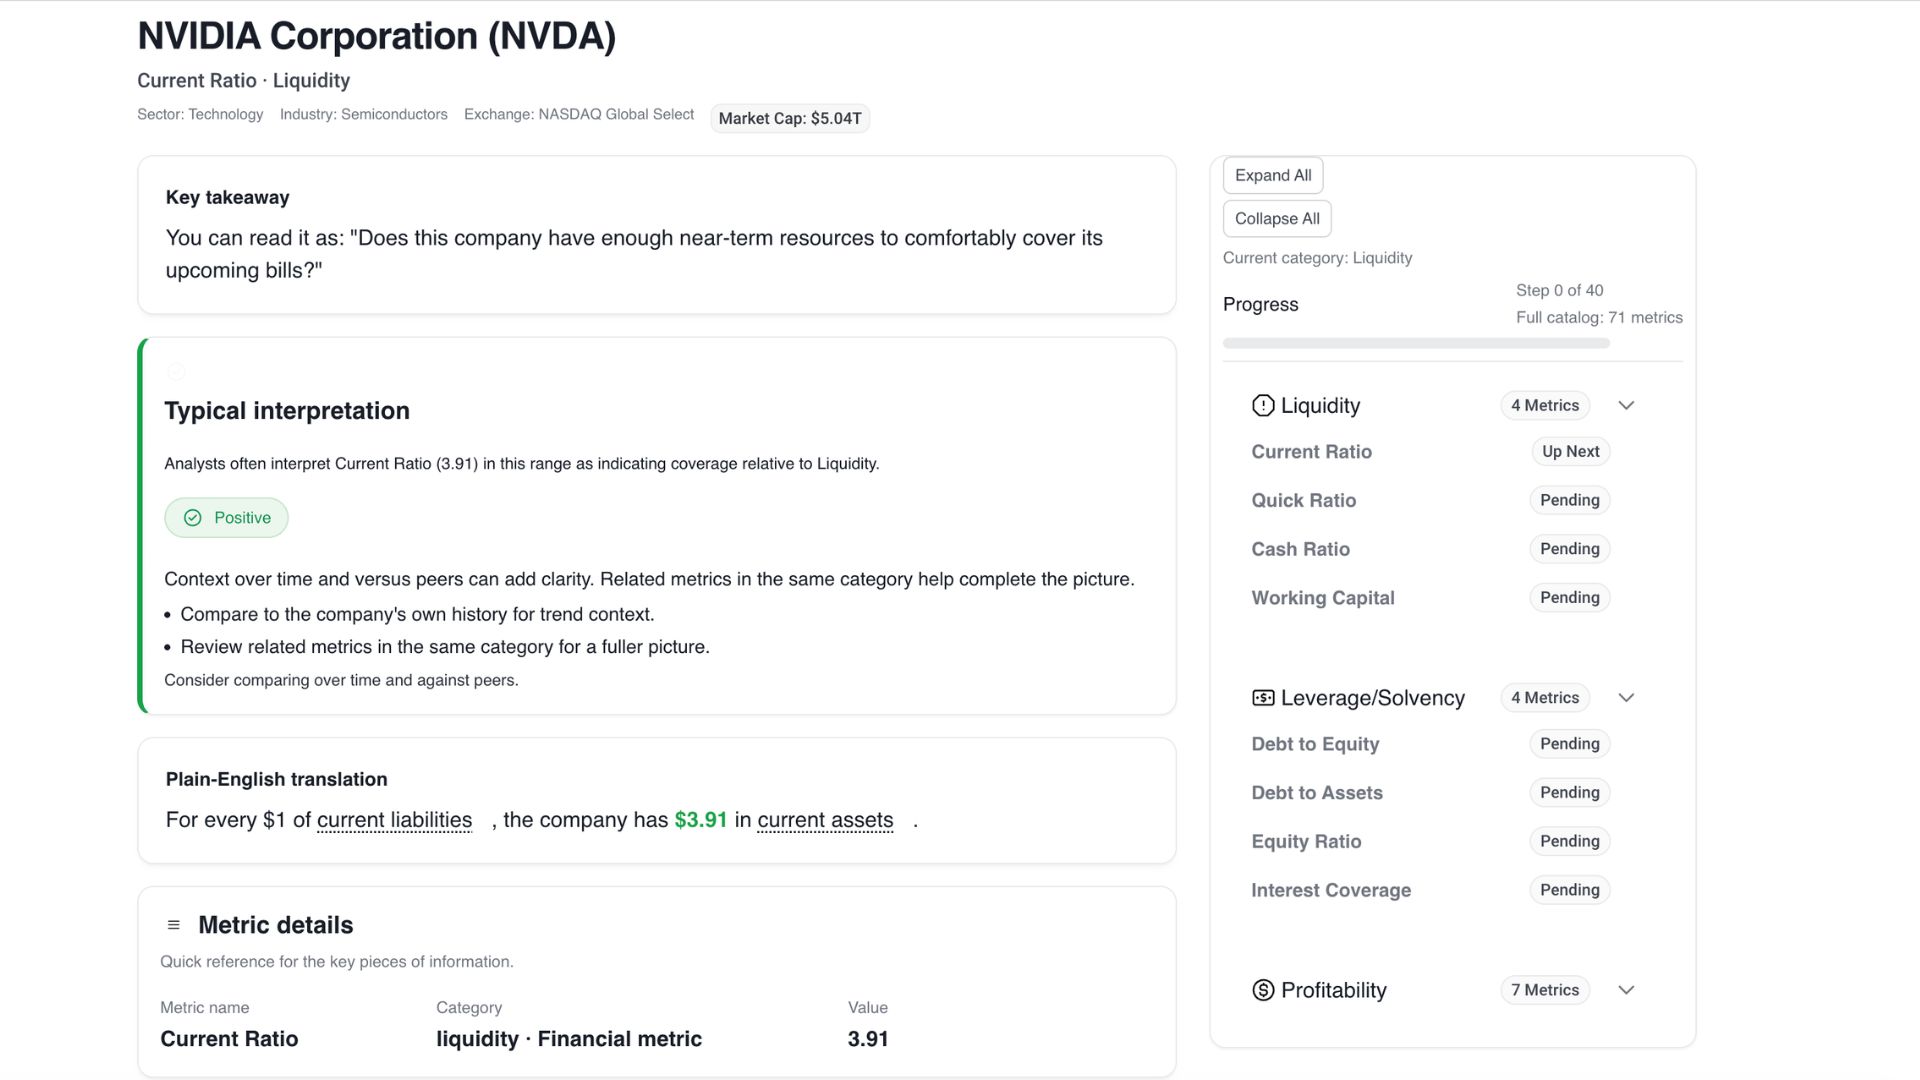
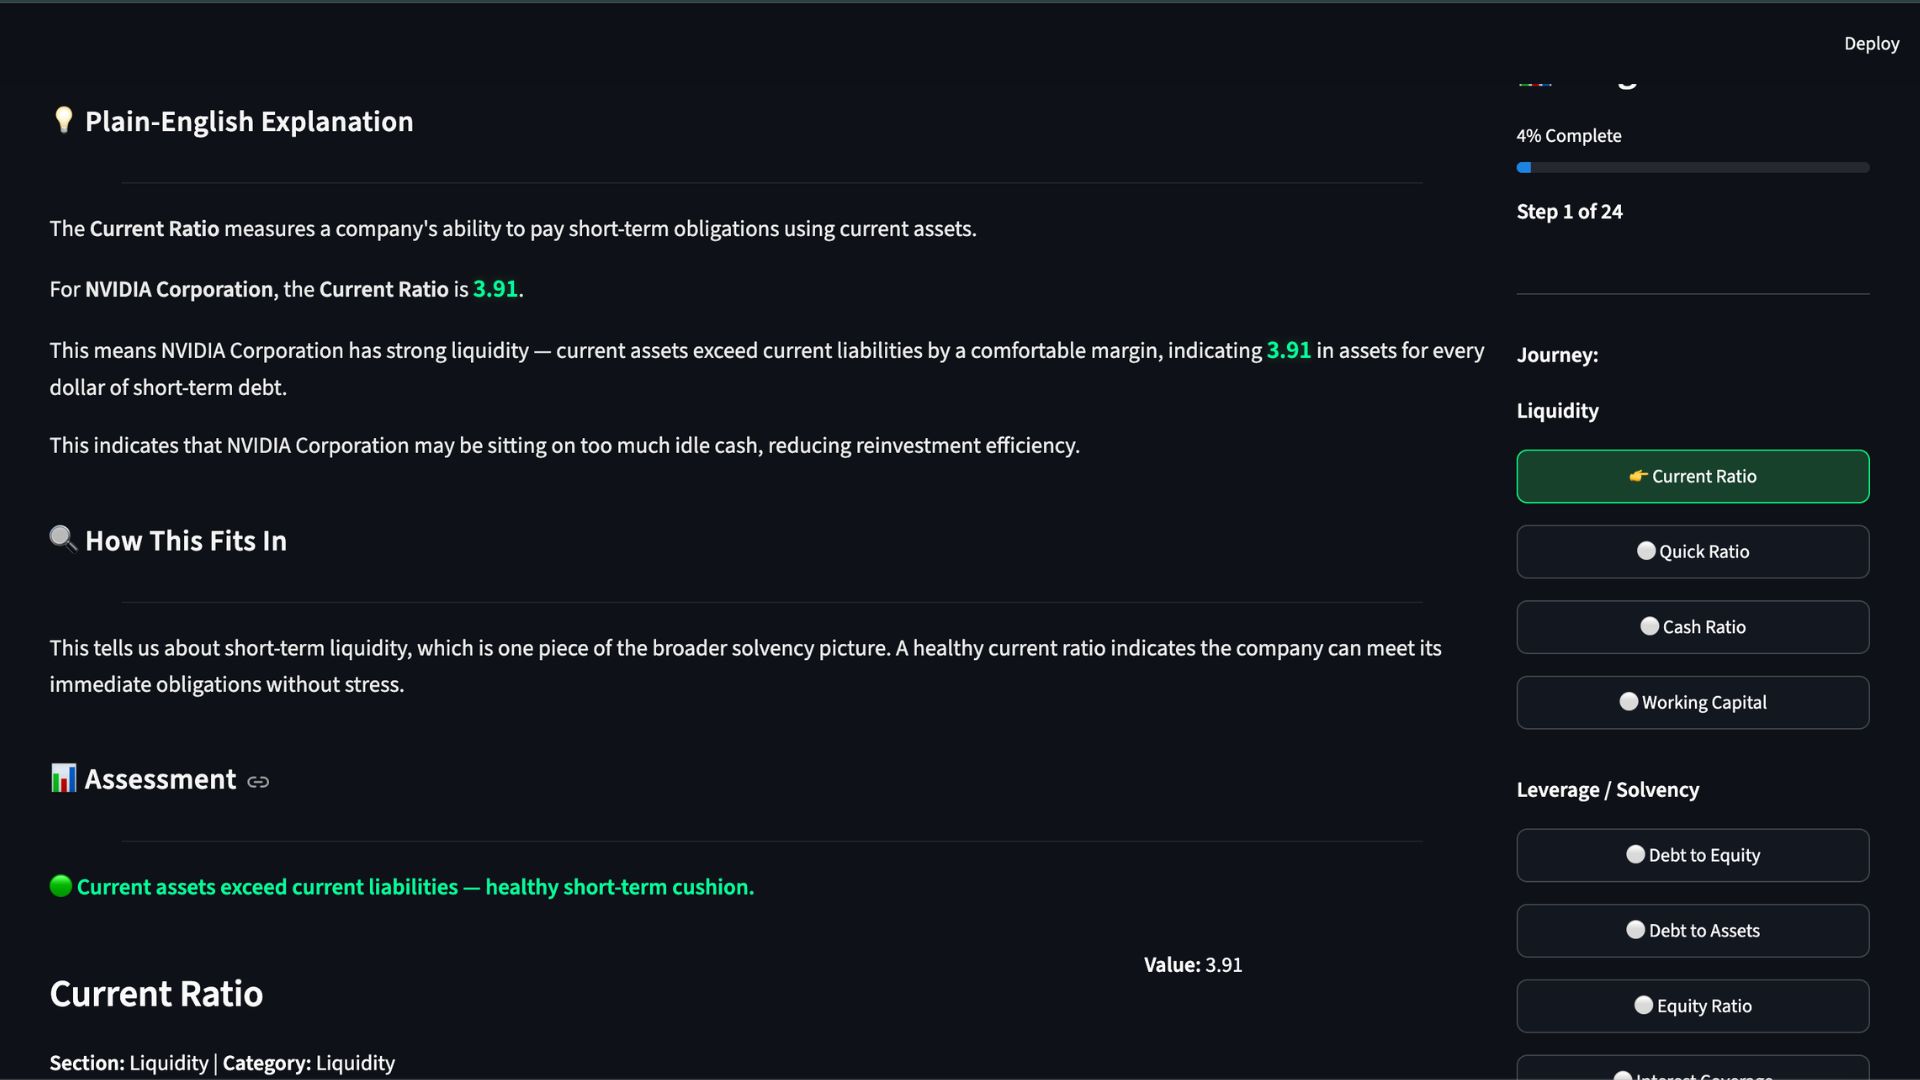
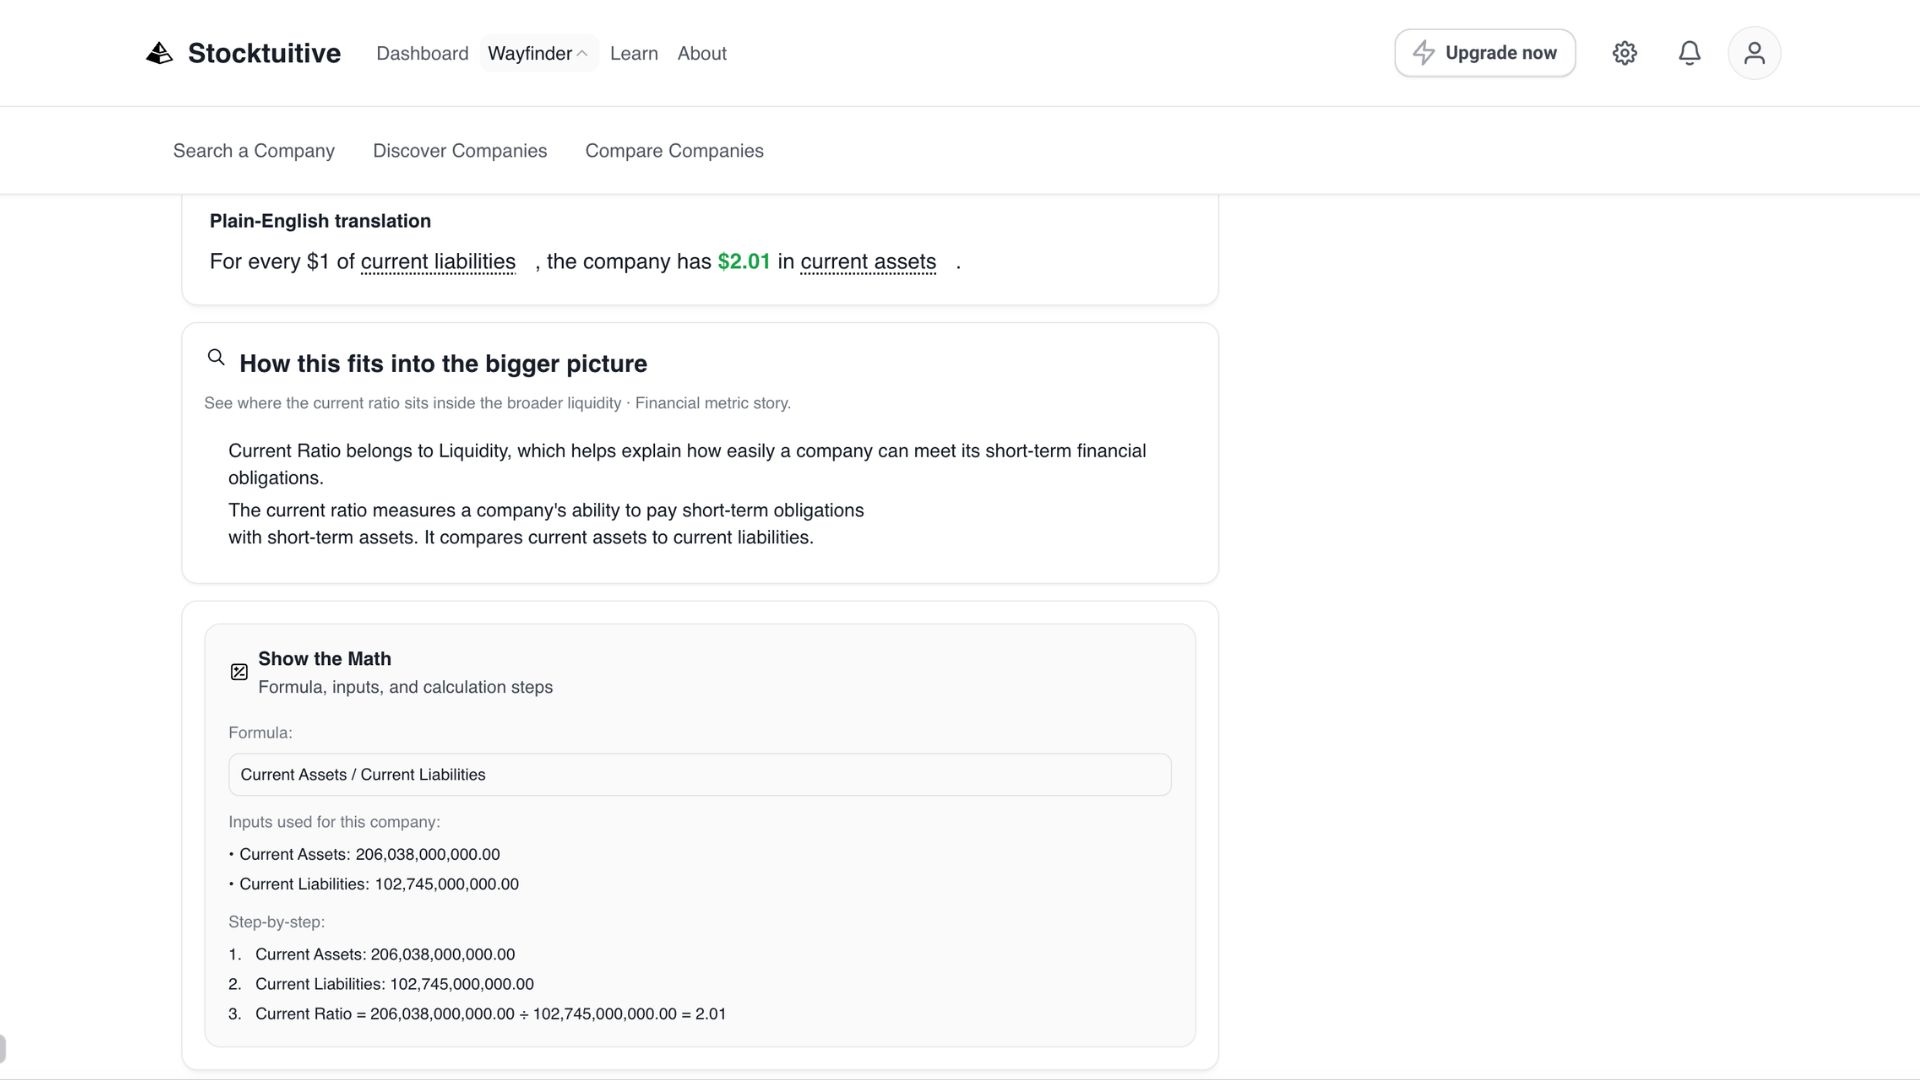
The guided analysis view walks users through each metric with a plain-English takeaway, interpretation, formula, inputs, and calculation steps.
01 / Problem
Financial data is everywhere. Clear understanding is rare.
The problem is not that retail investors lack access to markets. The problem is that access does not automatically create understanding.
Anyone can open a trading app, follow a chart, or react to headlines. But understanding a company’s fundamentals requires financial statement literacy: knowing how revenue, profit, debt, cash flow, liquidity, and valuation connect.
Stocktuitive bridges that gap by turning fundamental analysis into a guided workflow. It calculates the metrics, explains them in plain English, and shows the math behind each result so users can understand what the numbers actually mean.
Stocktuitive turns financial statement data into guided understanding.
02 / Research Foundation
Where the product started.
[ Where the product started ]
Stocktuitive began with a research paper I wrote on the gap between market access and financial understanding among retail investors. The paper argues that while digital trading platforms have made investing easier than ever, many retail investors still struggle to interpret financial statements, valuation metrics, and company fundamentals.
That research became the foundation for Stocktuitive: a guided analysis tool designed to compute financial metrics, translate them into plain English, and help users understand the ‘why’ behind a company’s financial position.
Core thesis: retail investors do not just need more market access; they need tools that turn financial data into understanding.
Making Fundamental Analysis Accessible for Retail Investors
Samuel J. Potozkin · PDF
Research paper by Samuel J. Potozkin
Explored how educational, plain-English financial analysis tools could reduce the friction of using fundamental data.
Read the paperQuick Context
Fundamental vs. Technical Analysis
Technical analysis focuses on price movement: charts, patterns, momentum, and trading signals. It asks, ‘What is the stock price doing?’
Fundamental analysis focuses on the business itself: revenue, profits, debt, cash flow, valuation, and financial health. It asks, ‘How strong is the company underneath the stock price?’
Stocktuitive was built around fundamental analysis. Instead of only showing charts, it helps users understand the financial metrics behind a company and translates those metrics into plain English.
Price behavior
Technical Analysis
- -Stock charts
- -Price trends
- -Volume and momentum
- -Short-term trading signals
- -“What is the market doing?”
Business health
Fundamental Analysis
- -Revenue and profit
- -Debt and liquidity
- -Cash flow
- -Valuation ratios
- -Requires understanding how financial statements connect — balance sheet, income statement, cash flow, debt, profitability, liquidity, and valuation
- -“How strong is the business?”
Stocktuitive focuses on making that second layer easier to understand.
Stocktuitive focuses on the second question: helping users understand the company behind the ticker.
03 / Approach
A product, not a prediction engine.
Stocktuitive does not try to pick stocks. It translates fundamentals into structured context: what the metric means, how it is calculated, and why it matters.
Structured Fundamentals
Surface the financial metrics that actually drive understanding instead of overwhelming the screen with everything at once.
Transparent Calculations
Every metric exposes its formula, inputs, and calculation steps; no black-box scores or hidden weighting.
Guided Interpretation
Plain-English verdicts and interpretations sit alongside the numbers so non-specialists can reason about them.
04 / Evolution
From research paper to full-stack product.
Stocktuitive started as a research paper on financial accessibility for retail investors. It grew into a lightweight Streamlit prototype to validate the analysis logic, then a full product system in Figma, and finally a full-stack React/FastAPI application with a portfolio-safe interactive demo.
01; Research Paper
A written thesis on the gap between market access and financial understanding; the conceptual foundation for everything that followed.
02; Streamlit Prototype
An early Python prototype used to validate the plain-English analysis workflow before investing in a full product.
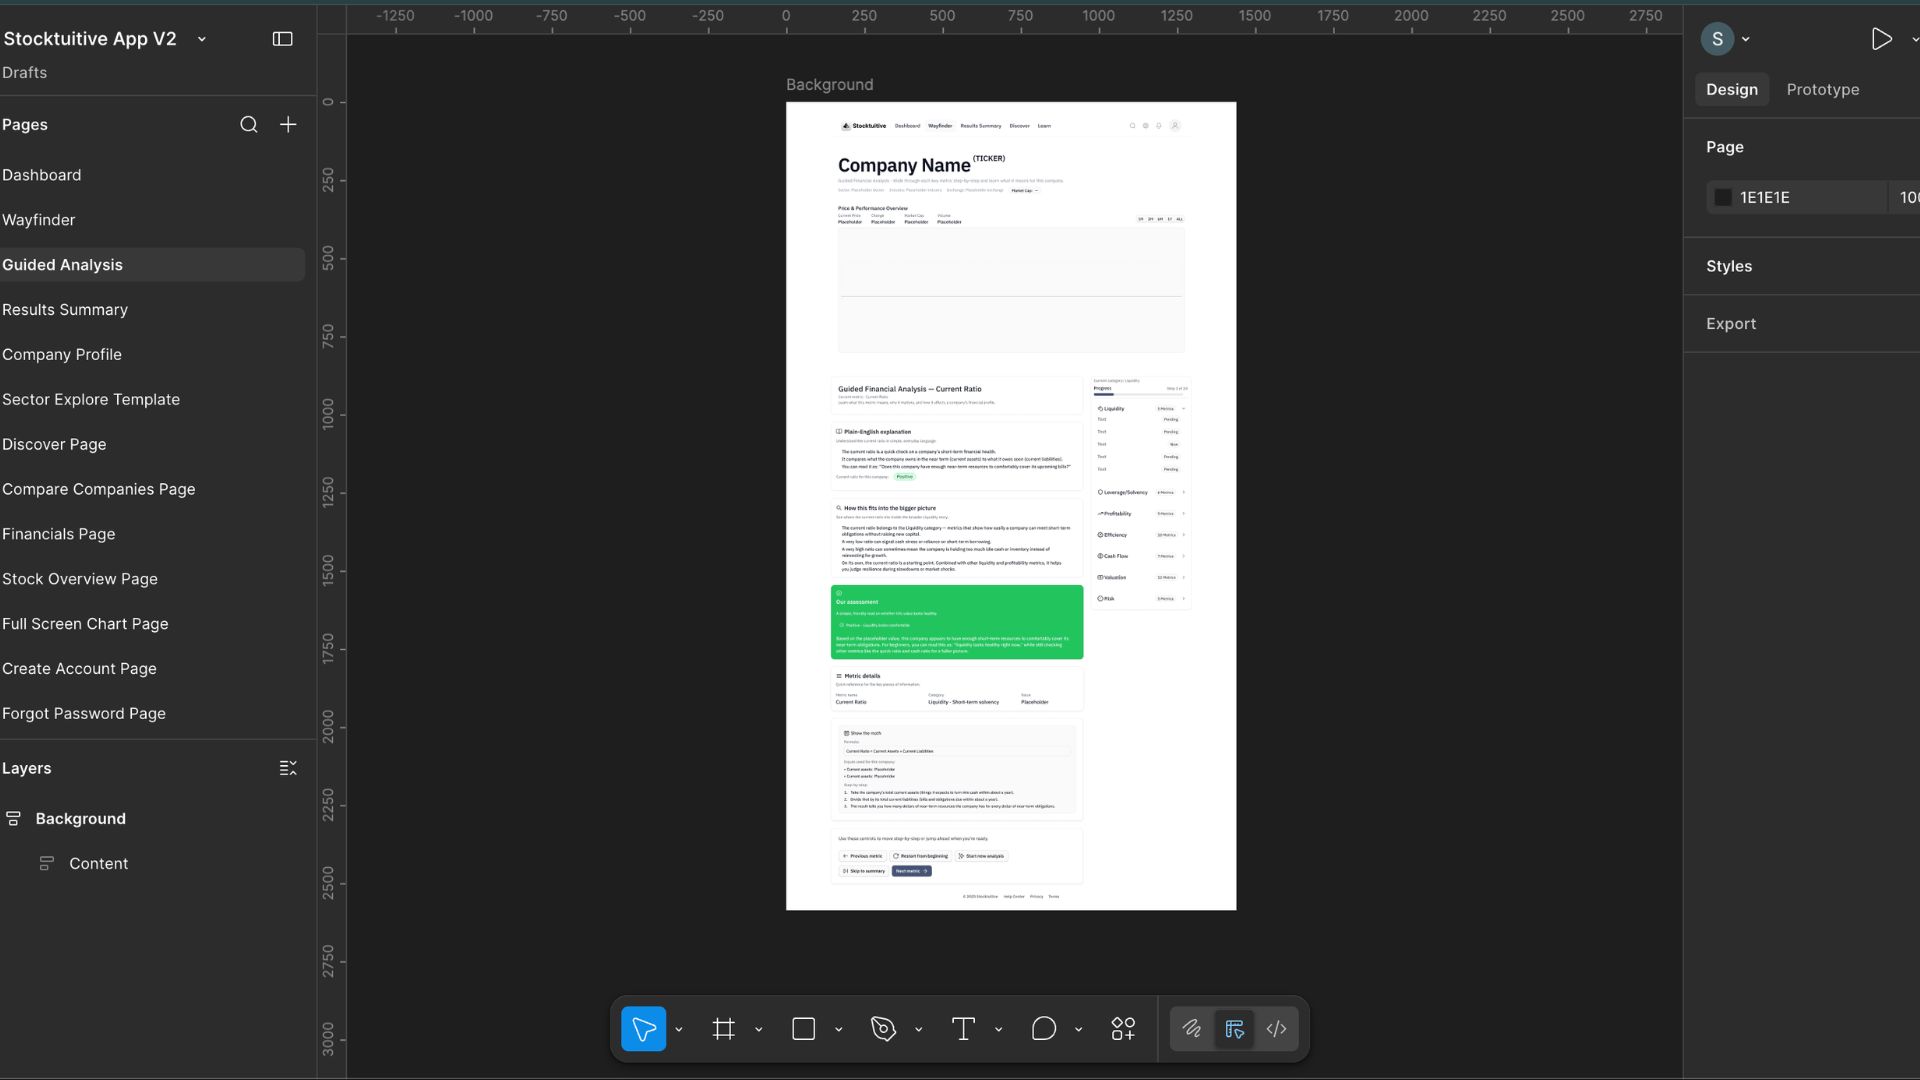
03; Figma Product System
Designed the guided analysis experience and surrounding product surfaces before translating into React.
04; Full-Stack Implementation
Rebuilt with React, TypeScript, FastAPI, and cached NVDA fixtures so reviewers can explore without live APIs.
05 / How It Works
From ticker input to guided insight.
In live development, Stocktuitive uses a FastAPI backend to process public company data and return structured analysis. For the public portfolio demo, the same UI runs on cached NVDA fixture data so reviewers can interact with the product without backend hosting, API costs, or fragile live market calls.
06 / Product Gallery
What reviewers actually see.
Guided Metric Walkthrough
Step-by-step navigation through each metric with verdicts, interpretation, and plain-English context.
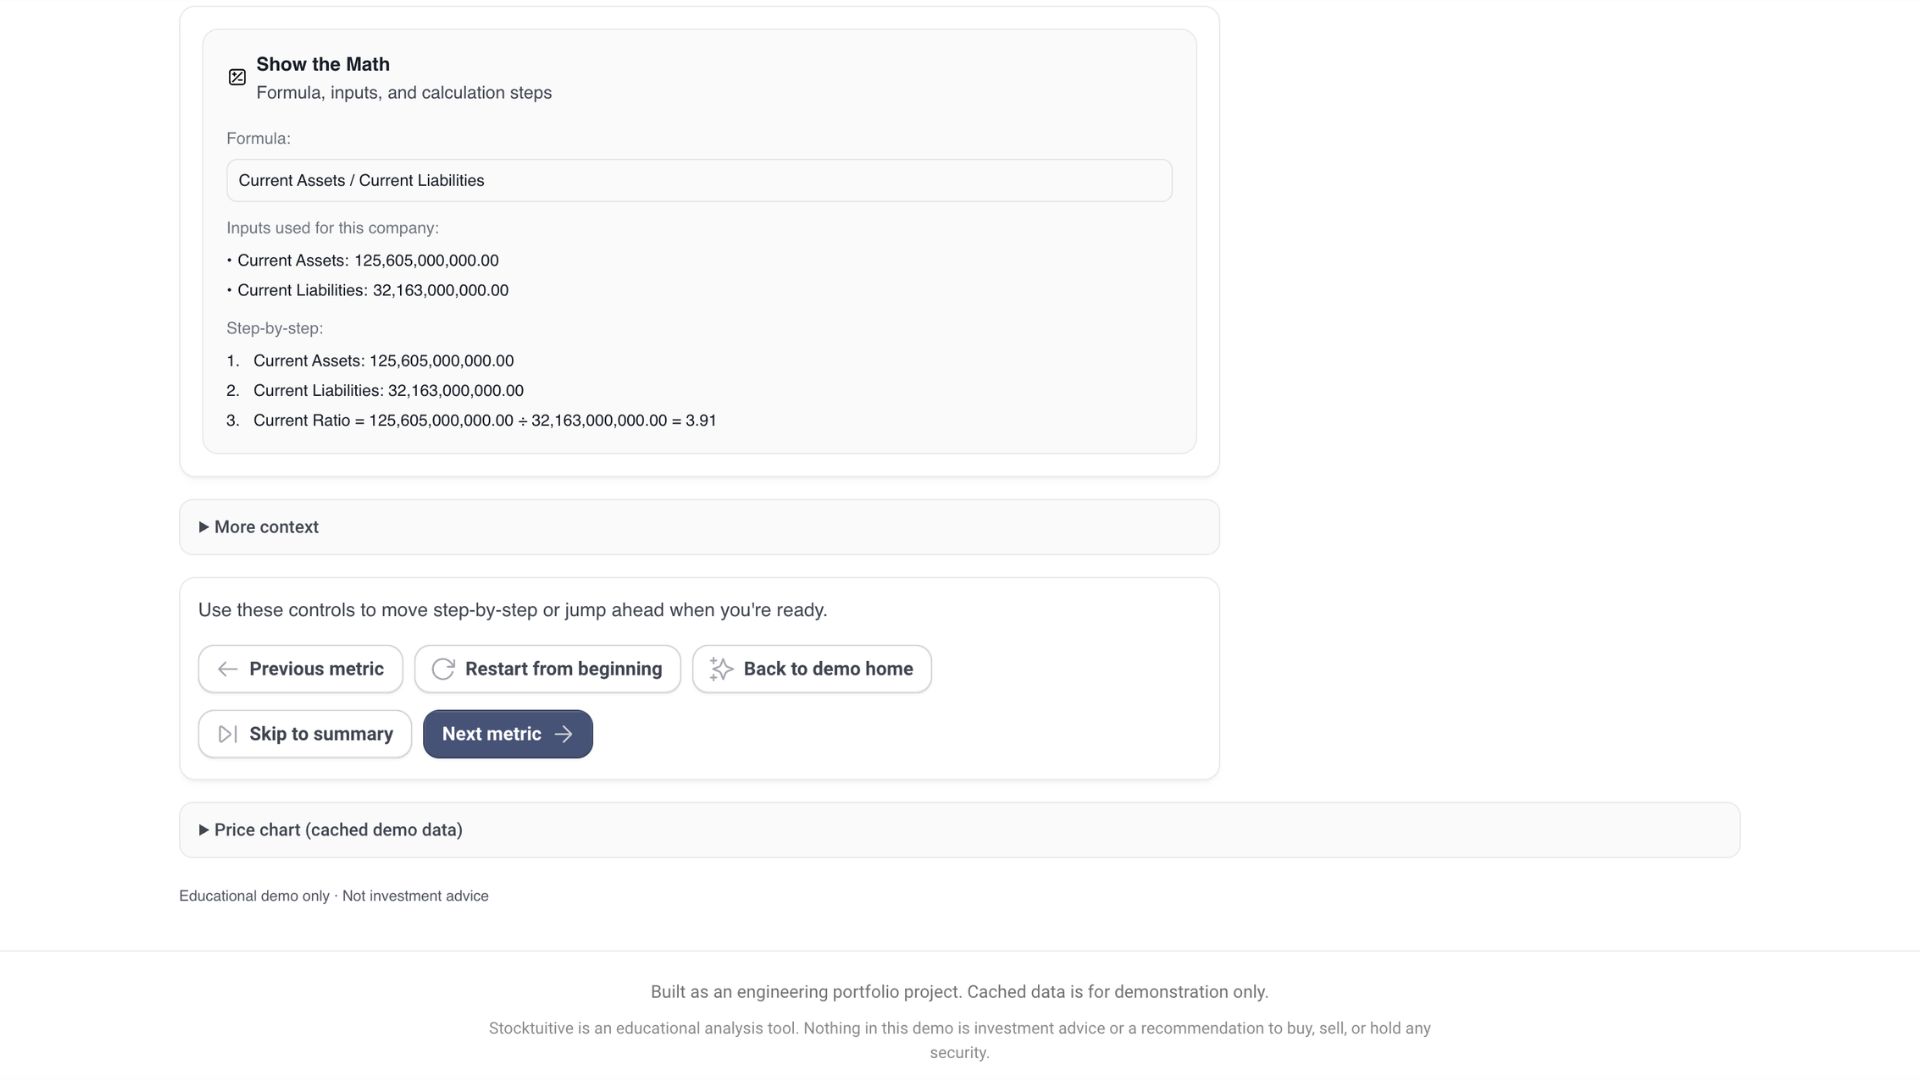
Show the Math
Expand any metric to see the formula, raw inputs, and arithmetic behind the verdict.
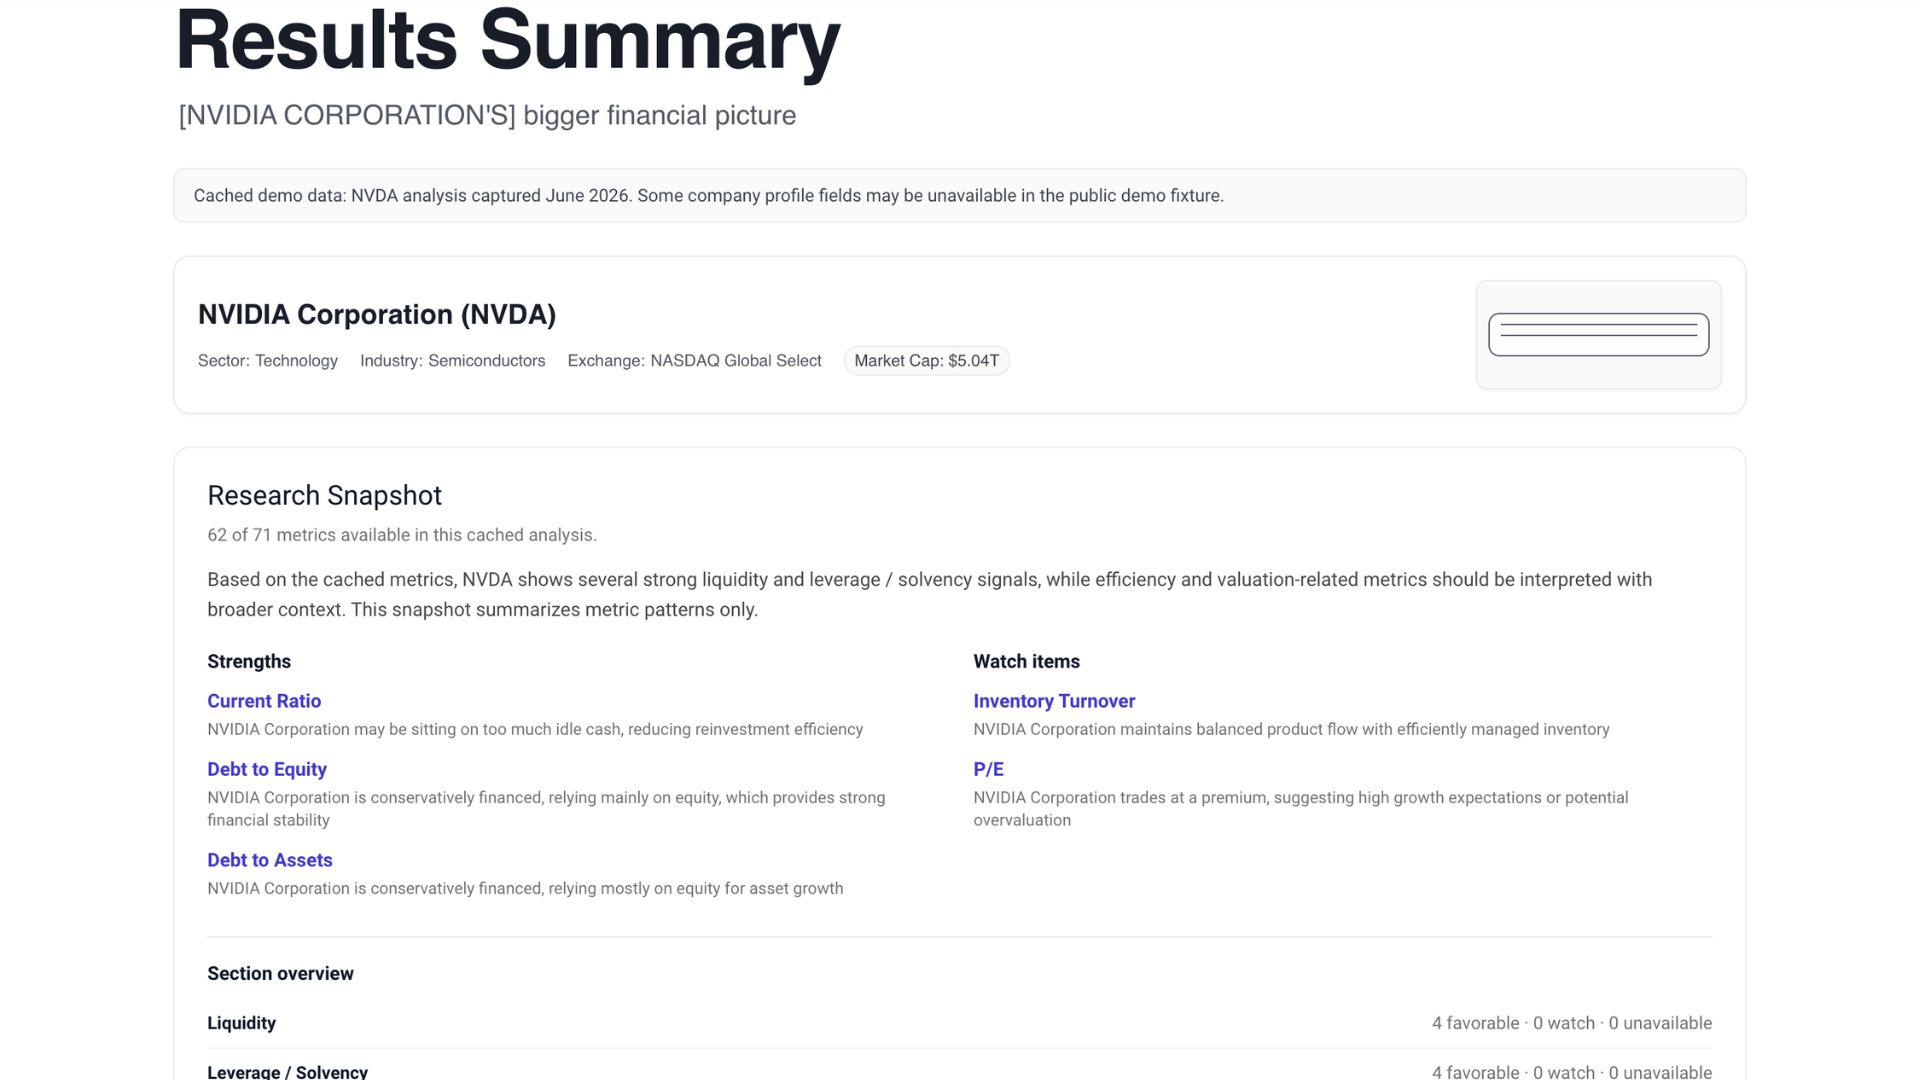
Research Snapshot
A consolidated view of strengths, watch items, and coverage across the cached analysis.
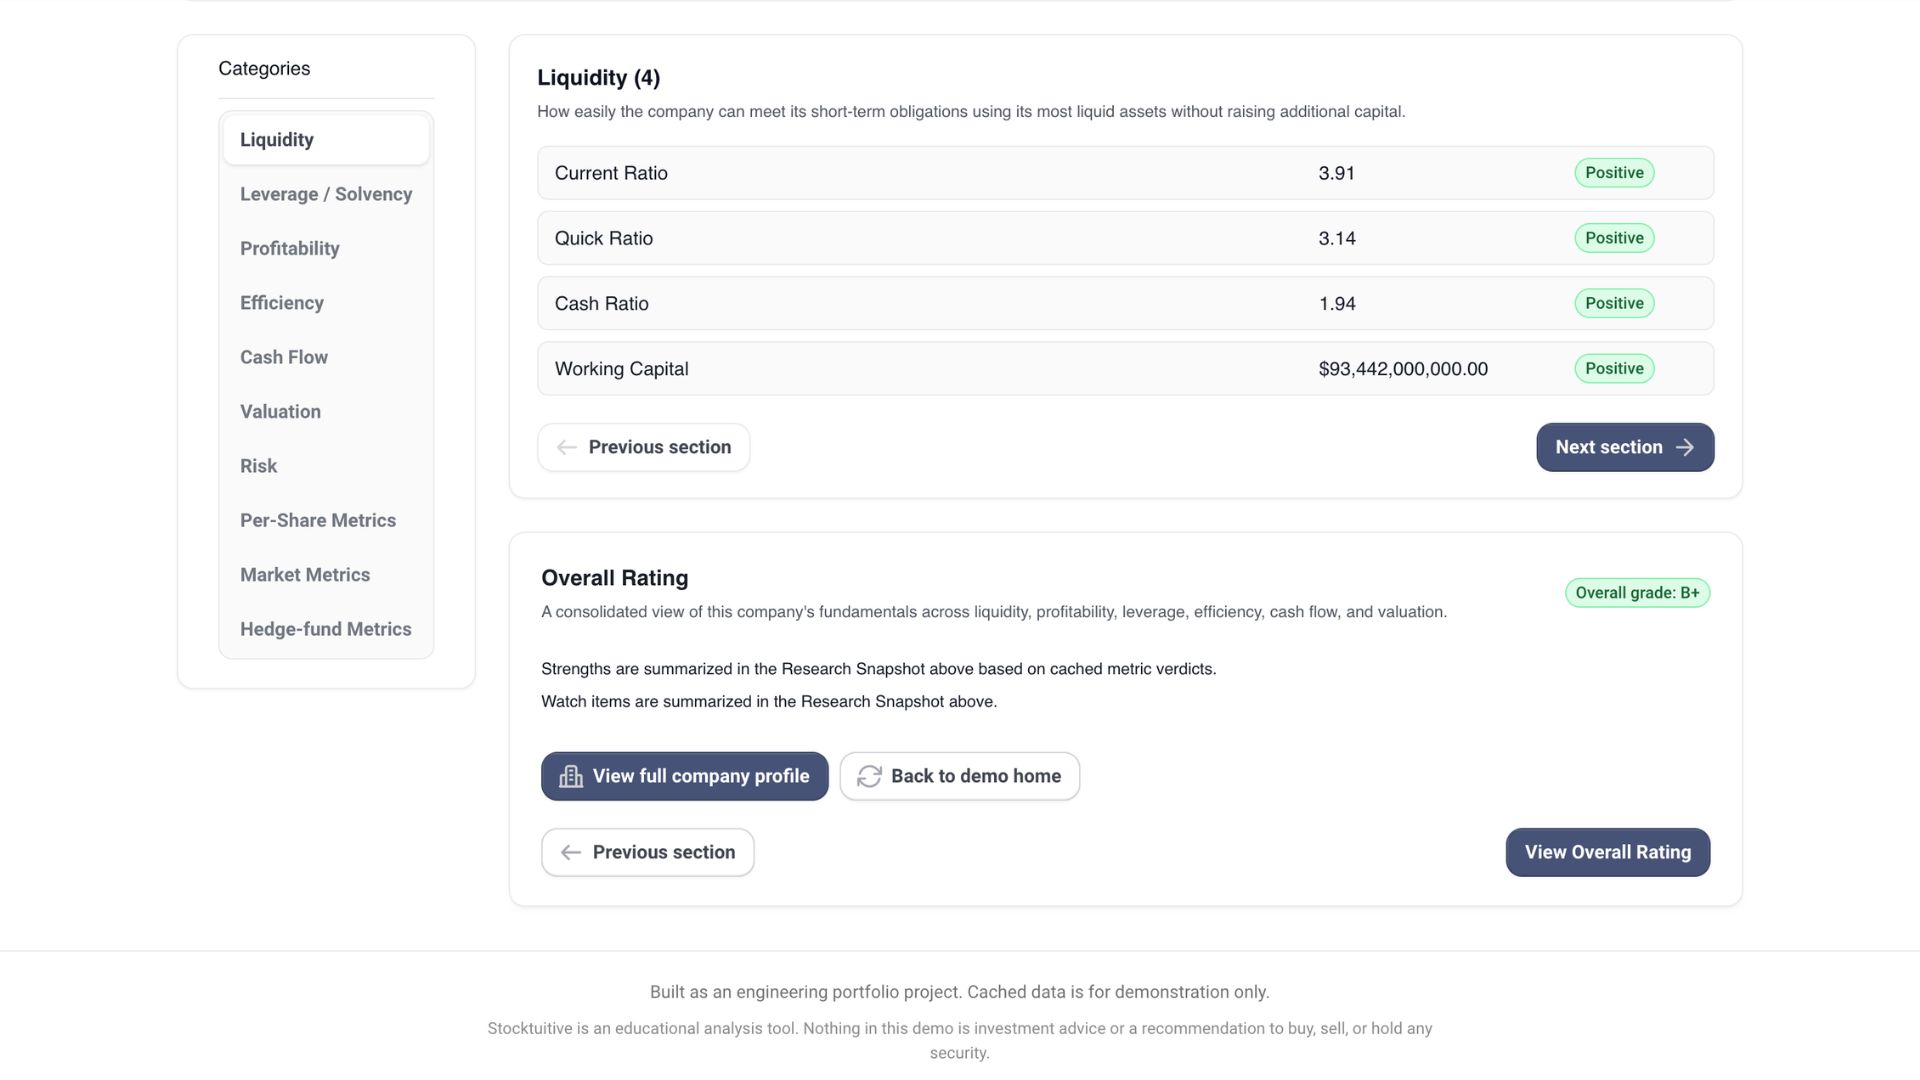
Results Summary
Section-level results organize the analysis across liquidity, profitability, valuation, risk, cash flow, and other categories.
07 / Under the Hood
Technical architecture.
Frontend
- React
- TypeScript
- Vite
- Tailwind
- ECharts
- Vitest
Backend
- FastAPI
- Python
- pandas
- numpy
- yfinance
- Pydantic
- pytest
Demo
- Cached fixture system
- VITE_DEMO_MODE=true
- No backend required
Live Mode
Demo Mode
08 / Live Development Build
Beyond the public demo.
The public demo focuses on the most reliable review path using cached NVDA data. Stocktuitive also exists as a broader development build with dashboard, ticker search, and backend-powered analysis for other public companies.
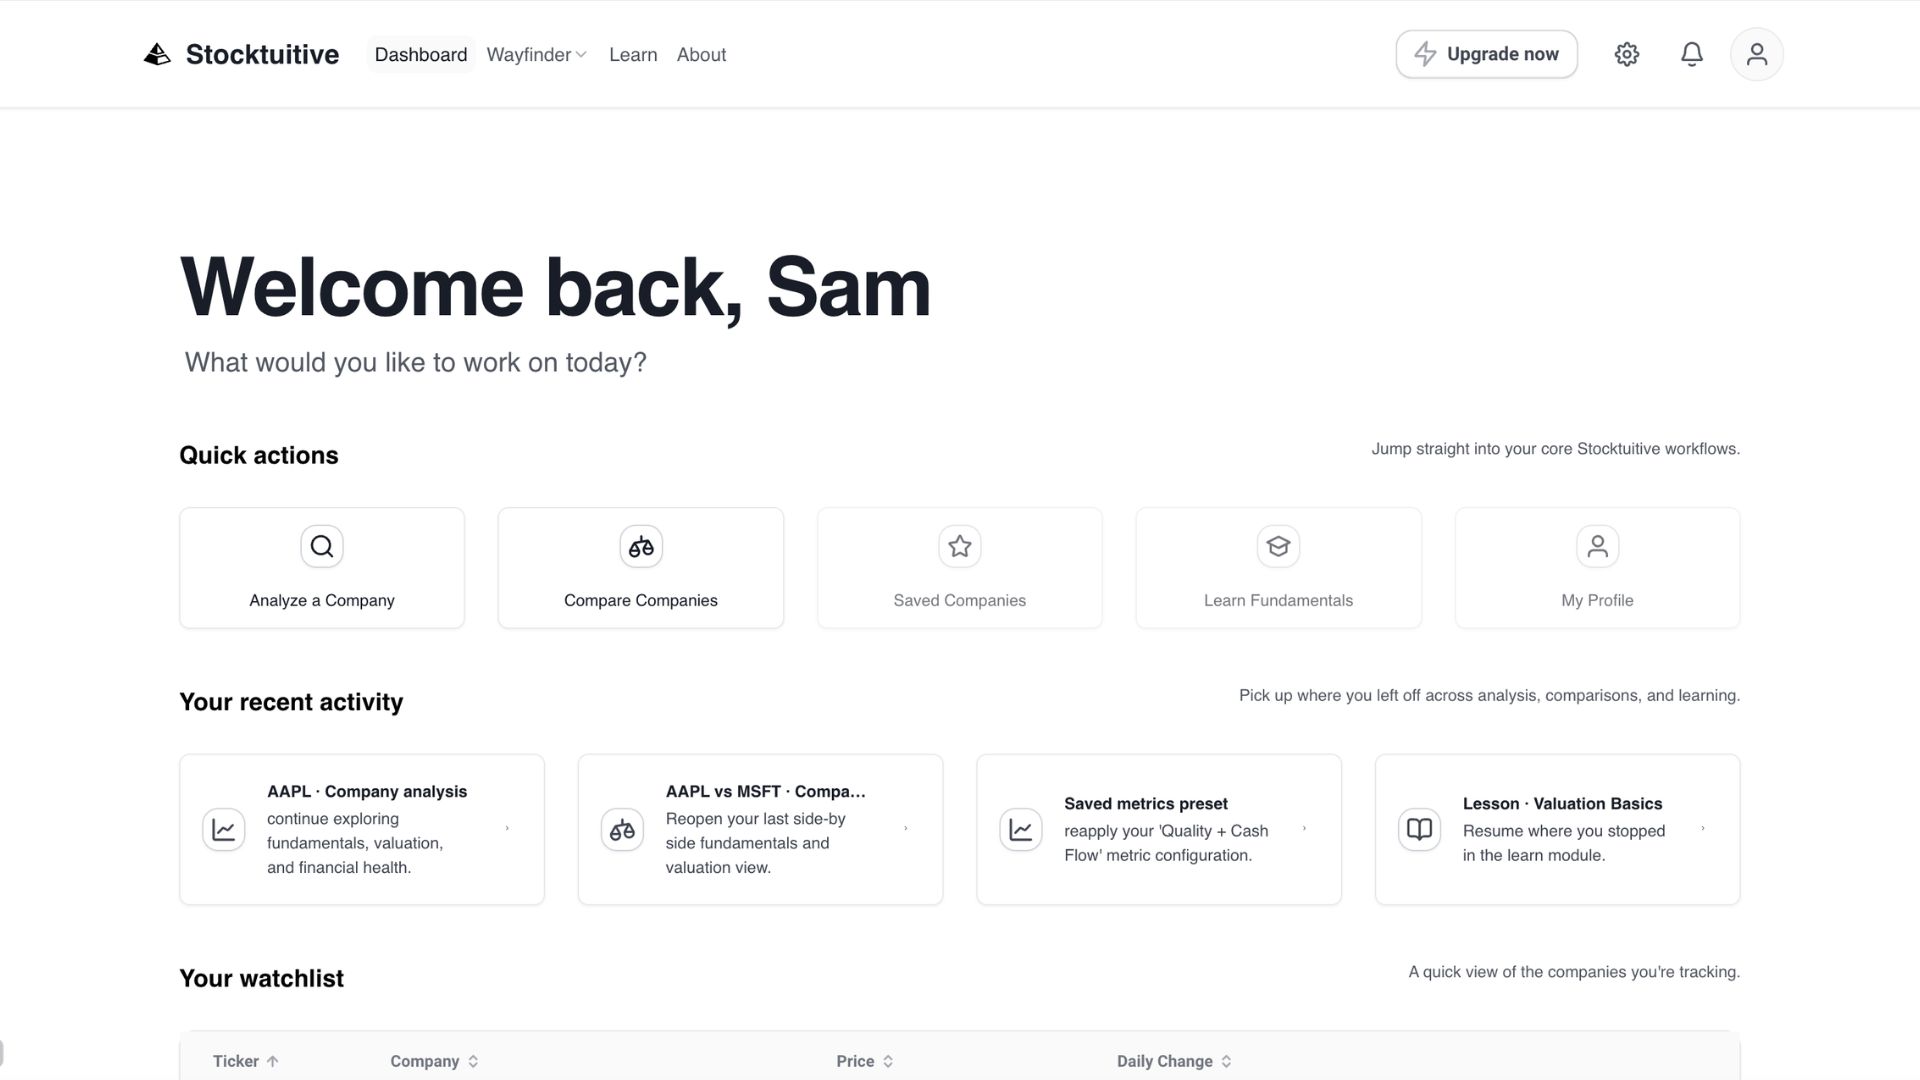
Dashboard shell
Broader app experience with quick actions, recent activity, watchlist, and learning surfaces.
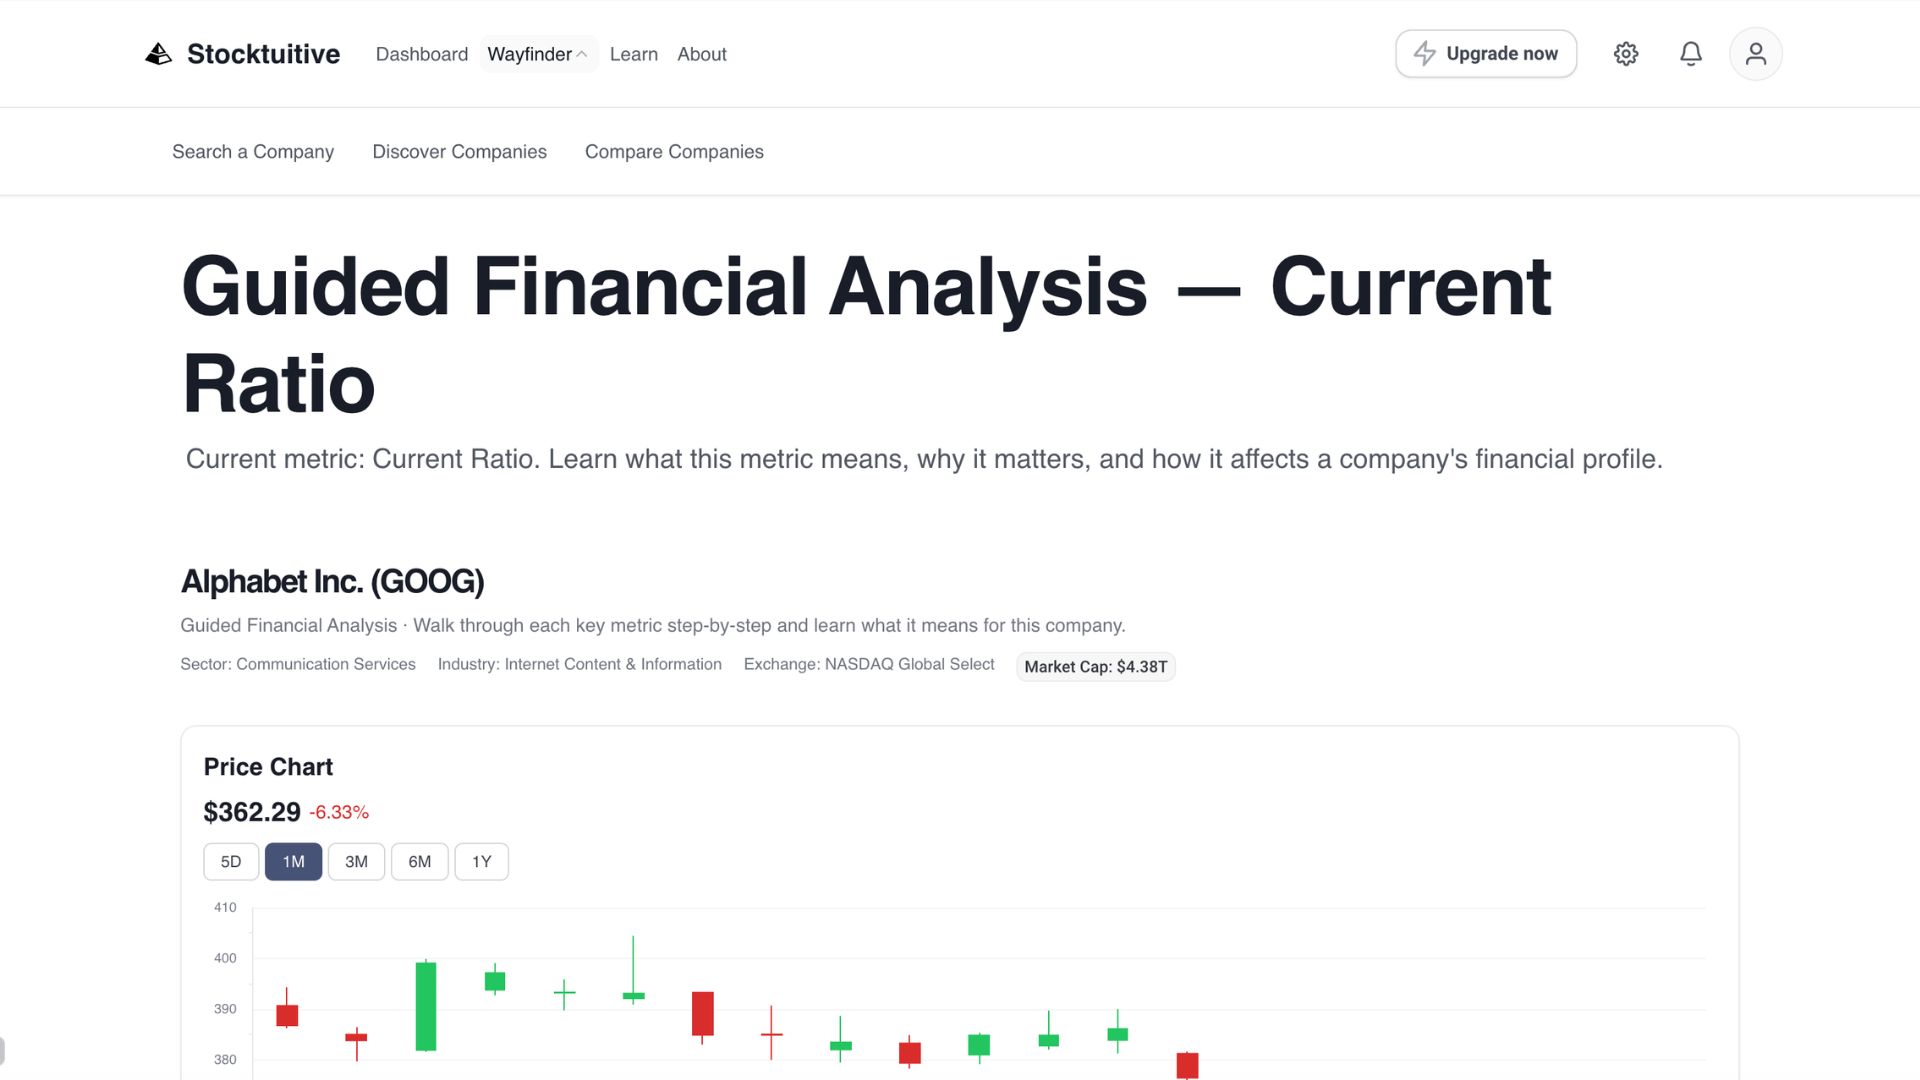
Backend-powered analysis
Live development build shown with Alphabet/GOOG, separate from the cached public demo.
Live calculation detail
The backend-powered app preserves the same explainable metric structure across different tickers.
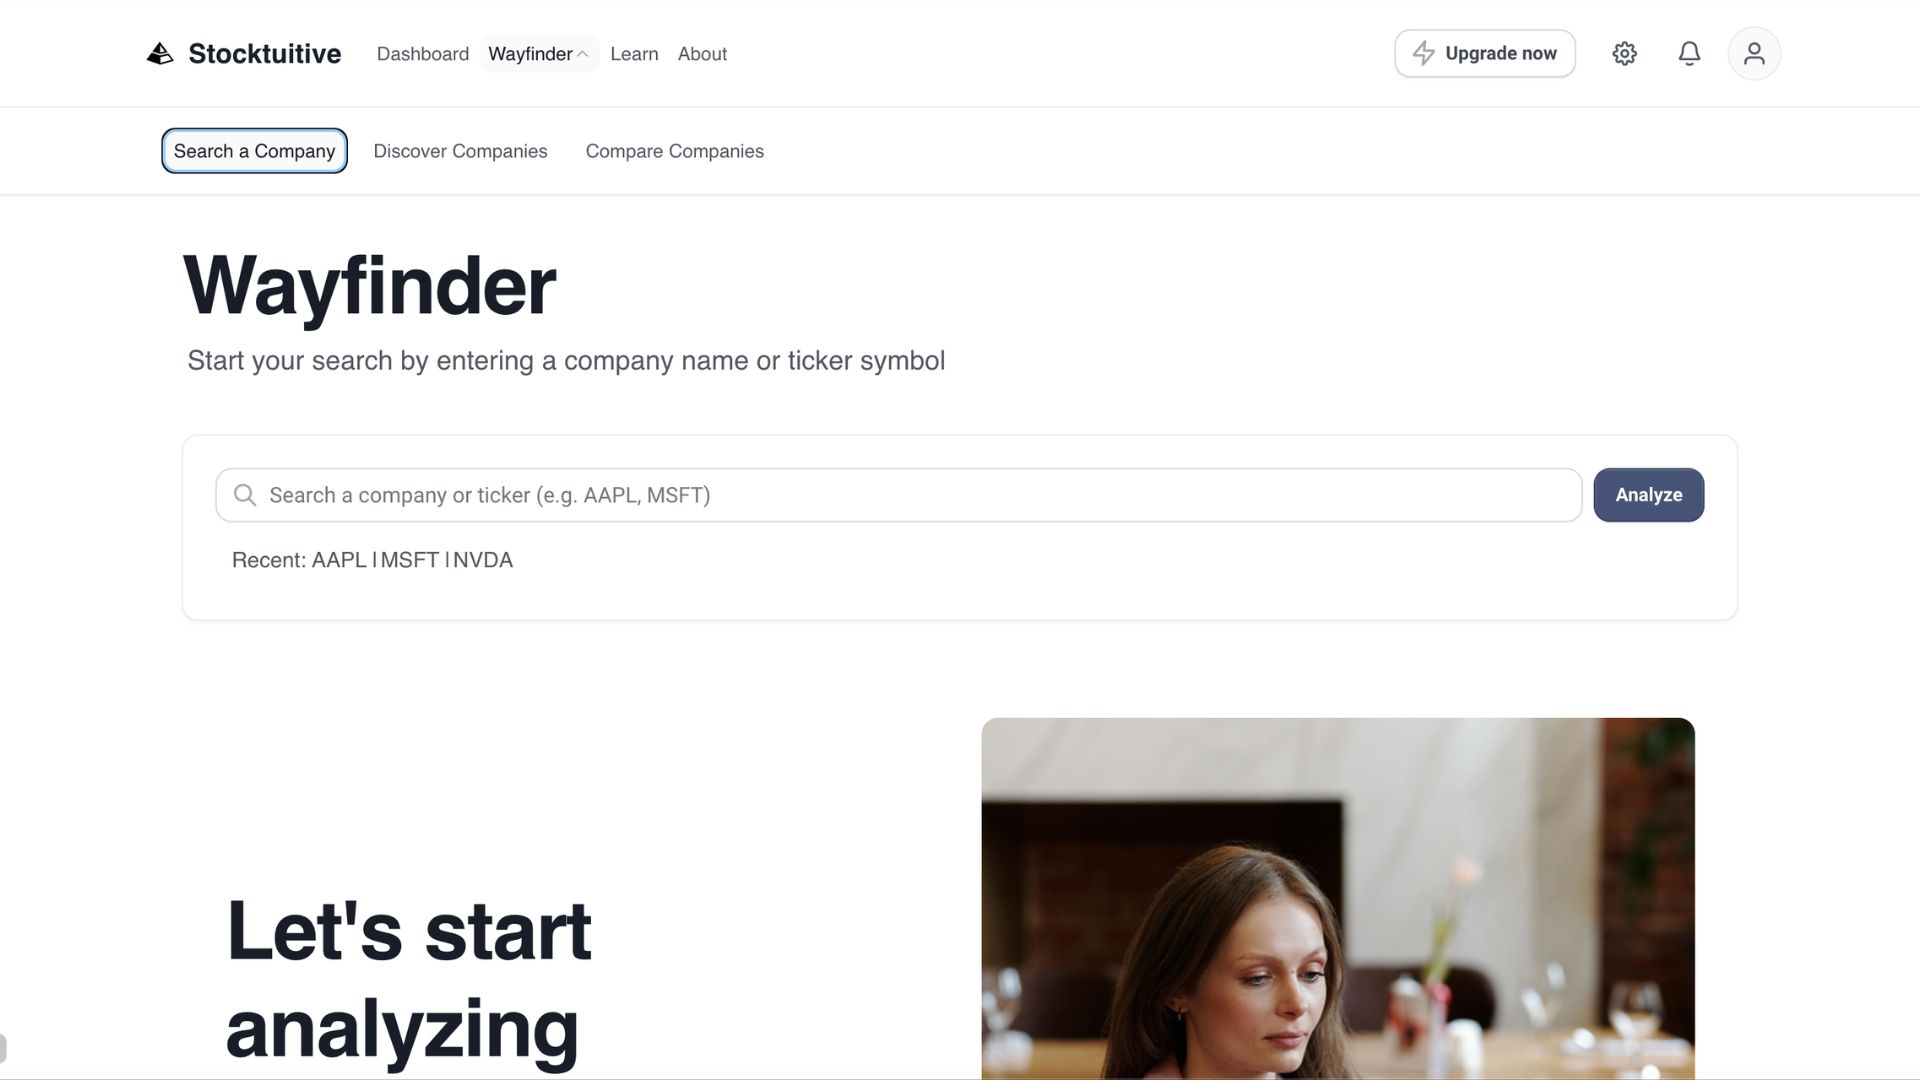
Ticker search flow
Wayfinder lets users start an analysis by entering a company name or ticker symbol.
Live development build; the public demo above is the reliable reviewer-facing experience.
09 / Interactive Demo
Try the Interactive Demo.
The public demo uses cached NVDA analysis data captured from the real Stocktuitive engine. It is intentionally static, so reviewers can explore the product without login, backend hosting, API keys, or live market-data failures.
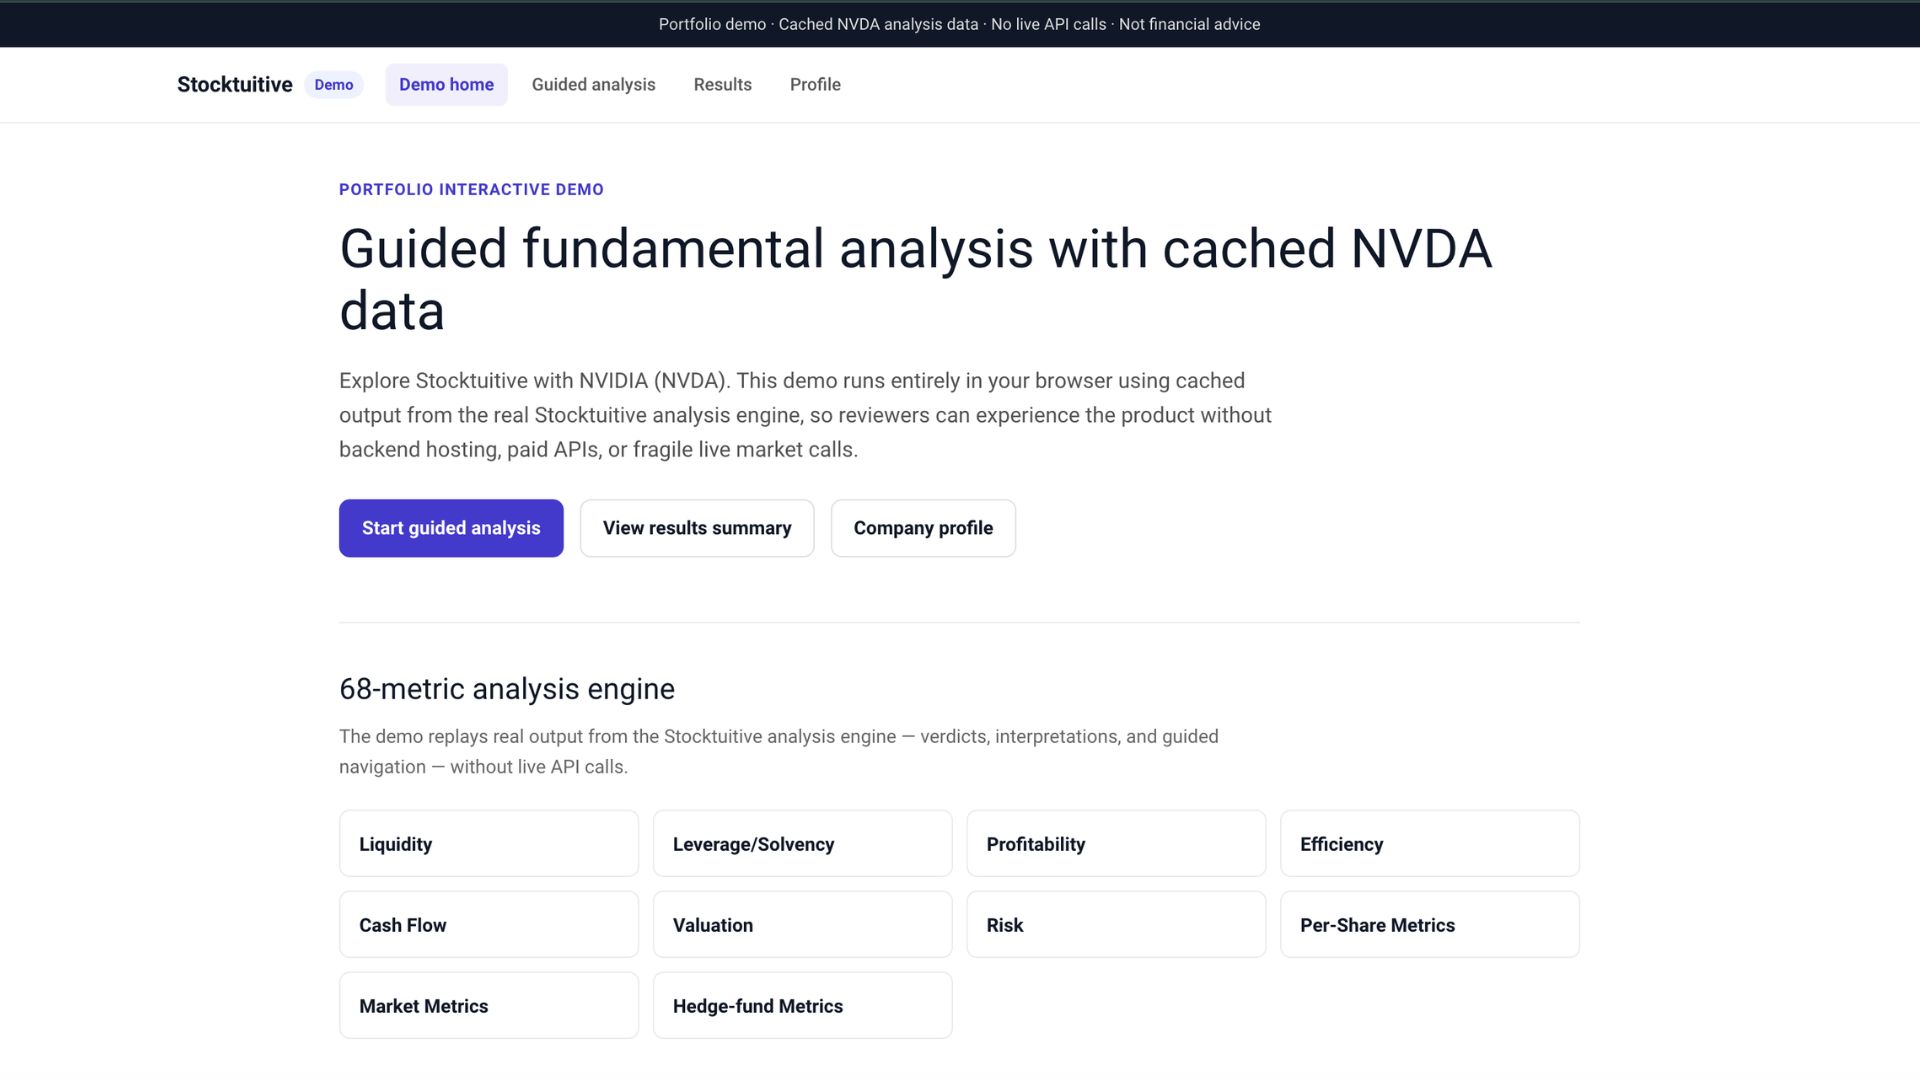
Portfolio-safe demo home; cached NVDA analysis data lets reviewers explore the workflow without login, backend hosting, API keys, or live market calls.
Explore the demo
Cached NVDA data · no login · portfolio-safe
Educational project. Not investment advice.
10 / Company Context
Context beyond the ratios.
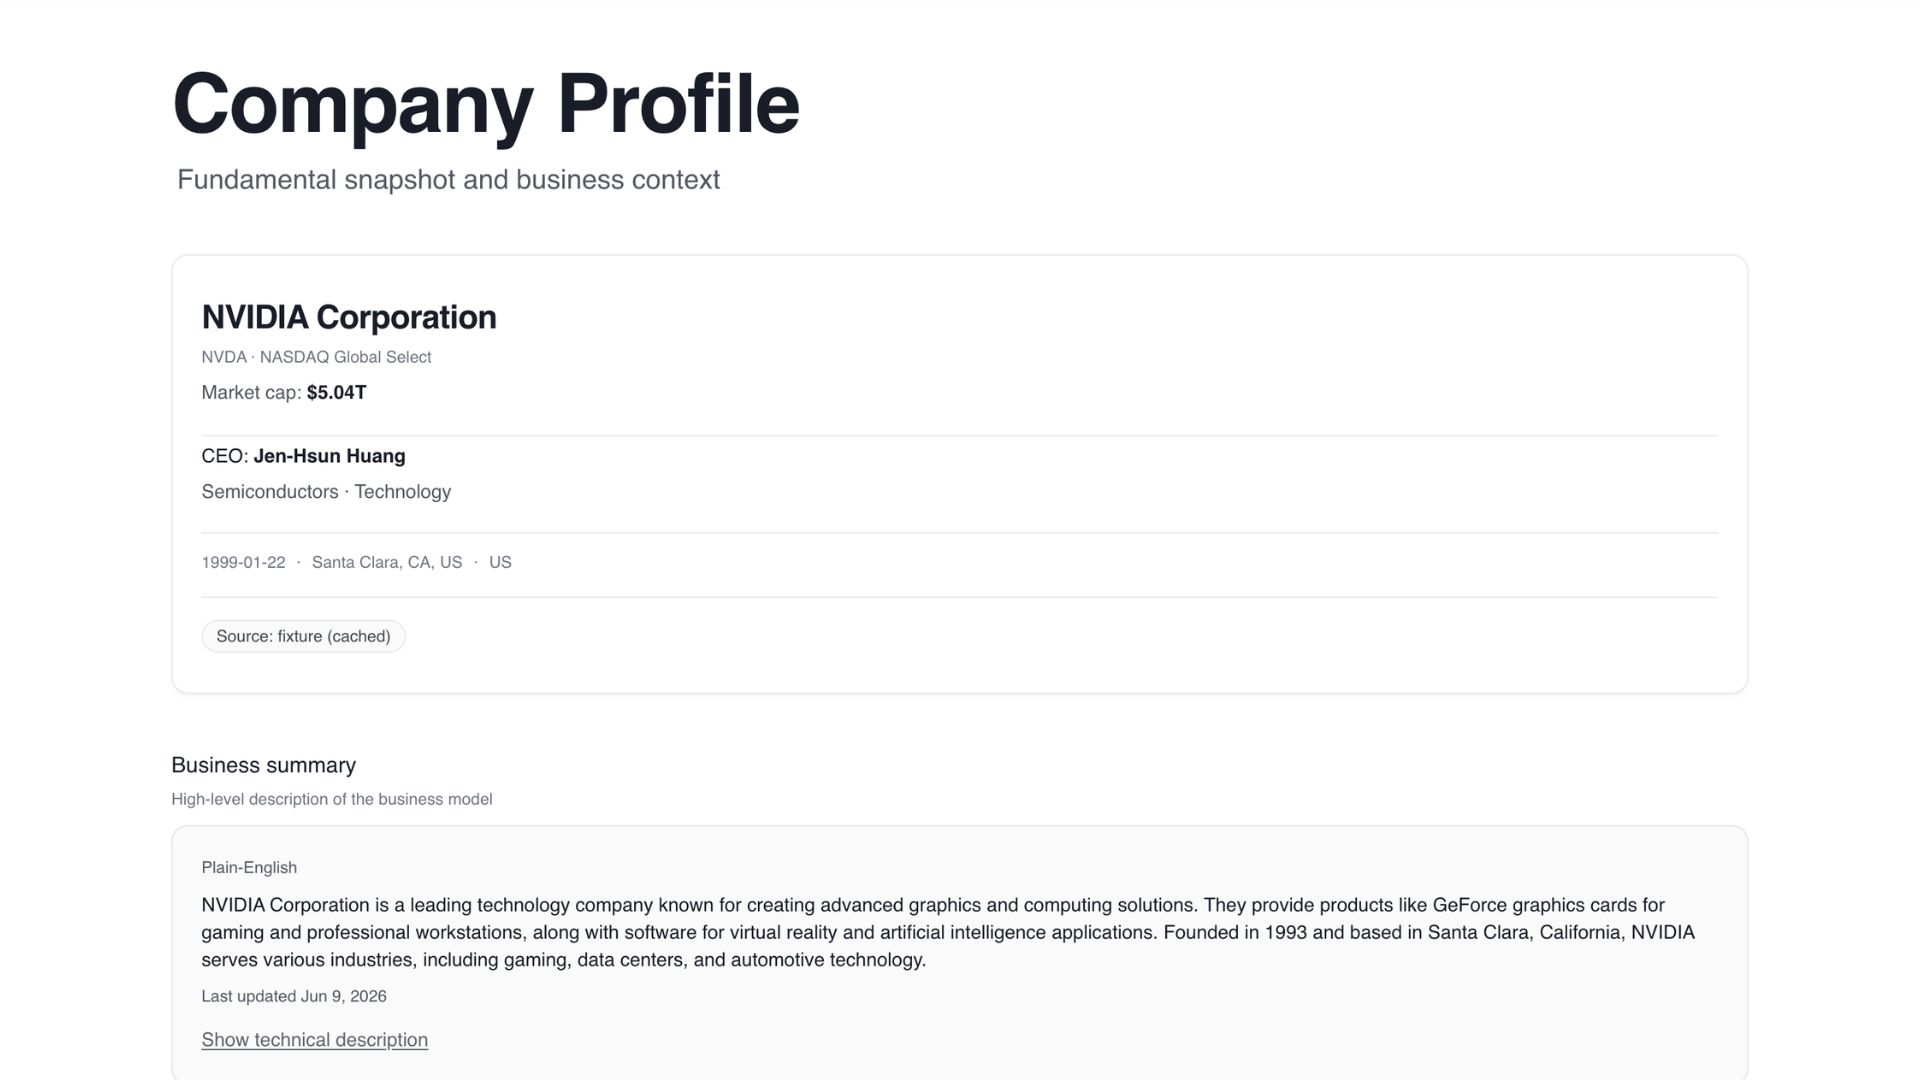
Company profile
Company profile context; business summary, metadata, and plain-English company background.
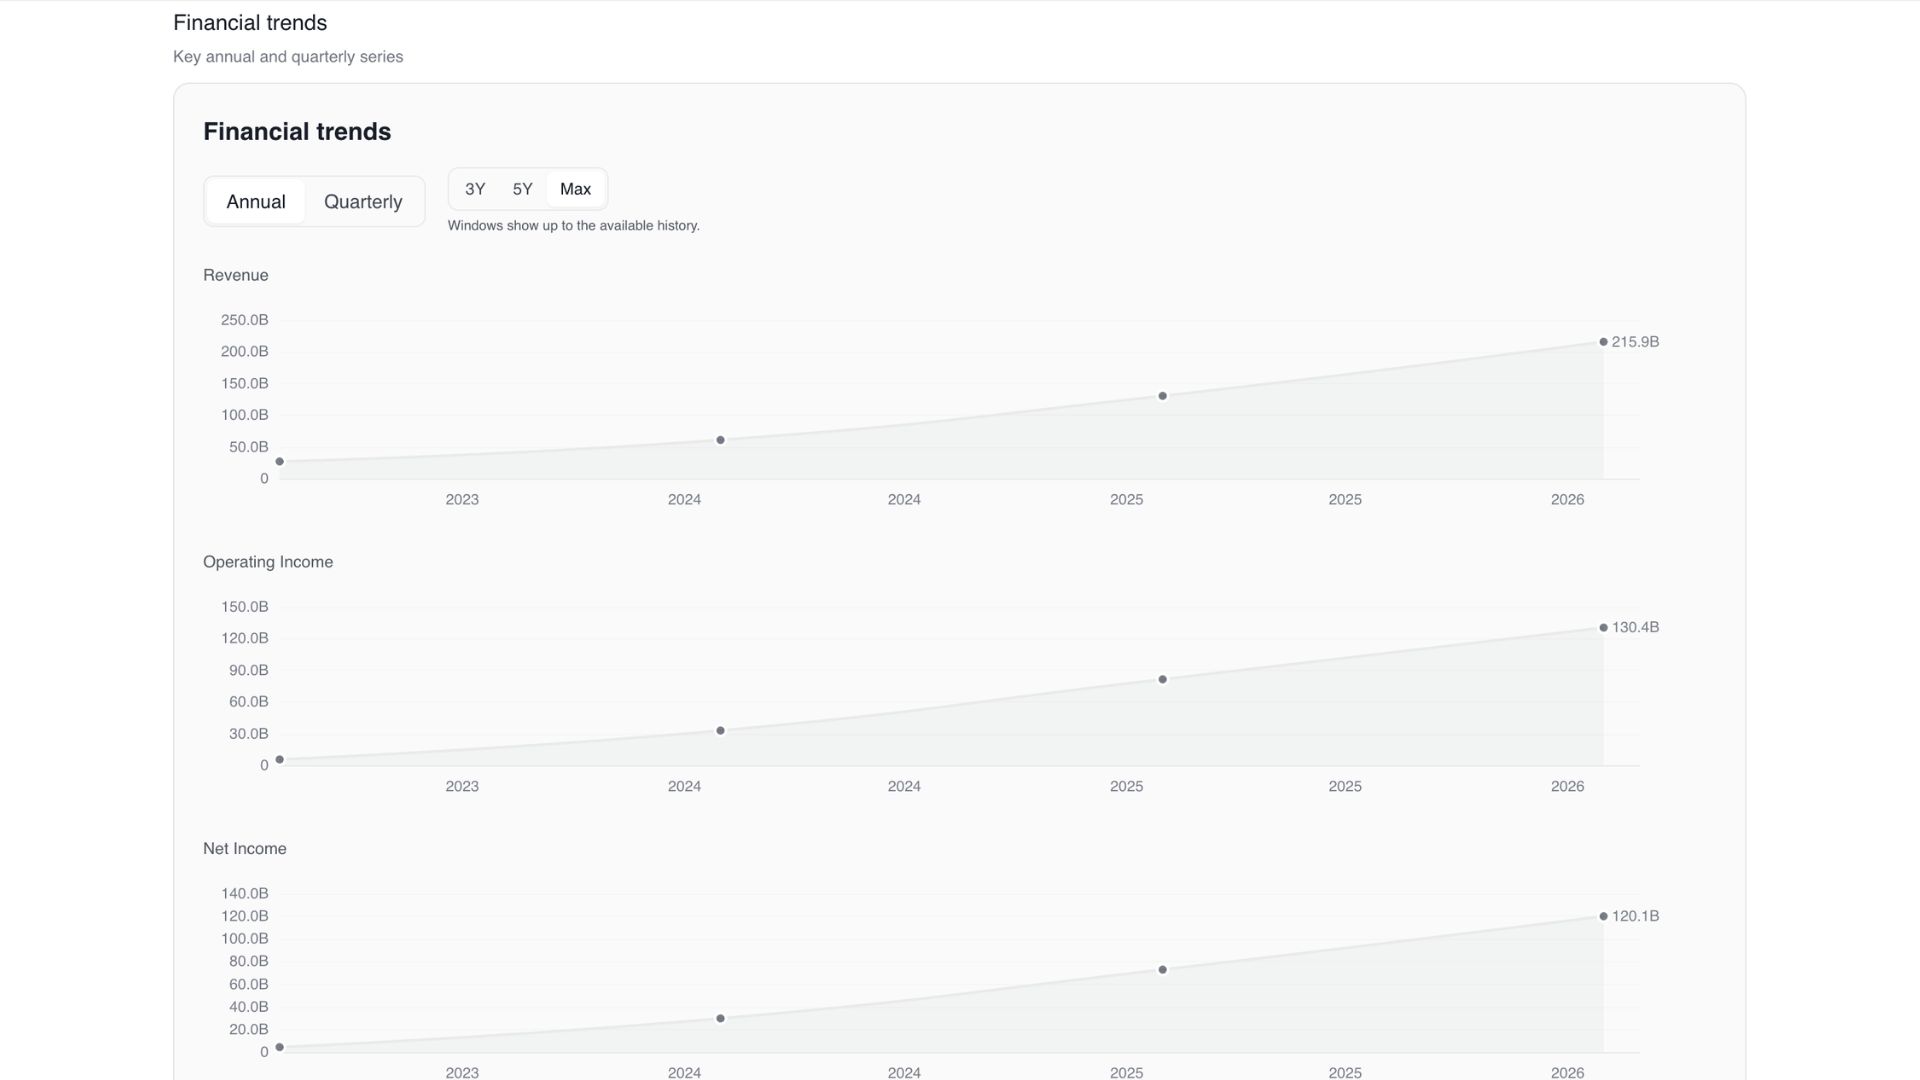
Financial trends
Financial trends; revenue, operating income, net income, and other historical views provide context beyond individual ratios.
11 / Scope
Boundaries are part of the product.
Stocktuitive is presented as an engineering and product portfolio project, not a production investing platform. Auth, billing, live provider integrations, and exploratory pages are intentionally excluded from the public demo to keep the experience reliable and honest.
Stocktuitive does not provide financial advice, does not predict which stocks will outperform, and does not represent personal investment results. It is a tool for understanding companies, not a recommendation engine.
12 / Outcome
Evidence that complexity can be made readable.
The same product approach; structure, hierarchy, restraint, and respect for the reader - extends to other domains where information density currently blocks understanding.
- -Built a full-stack fintech analysis workflow
- -Designed a guided UX for complex financial data
- -Implemented a portfolio-safe demo with cached fixtures
- -Communicated product boundaries clearly
- -Translated dense data into structured, readable insight